cartography
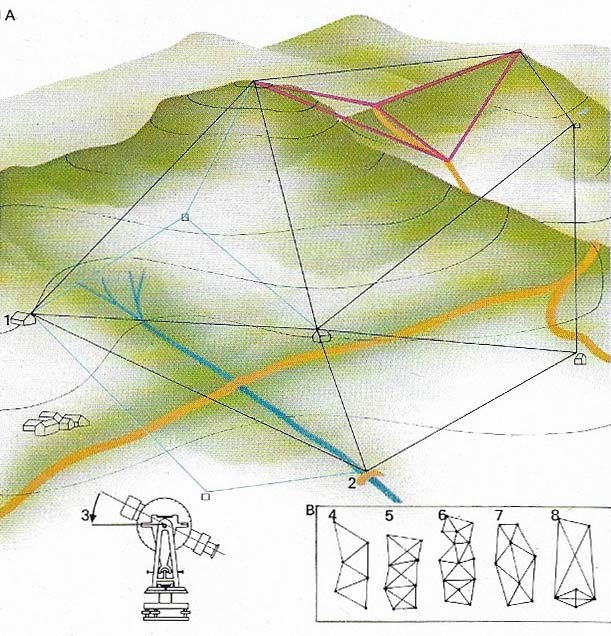
Figure 1. Triangulation is a method surveyors use to determine heights and distances from which a baseline (1–2), which is generally measured using a calibrated tape or a surveyor's chain. Angles from it – sometimes forming part of a map's grid – are measured by means of a theodolite (3). Detailed surveying requires a fine network of triangles (b). These may be simple triangles (4); braced (5) or centered (6) quadrilaterals; double-centered figures (7); or narrow quadrilaterals (8). The type adopted depends on local conditions – braced quadrilaterals are preferred in hilly terrain and centered quadrilaterals are usually used in surveying flat regions.
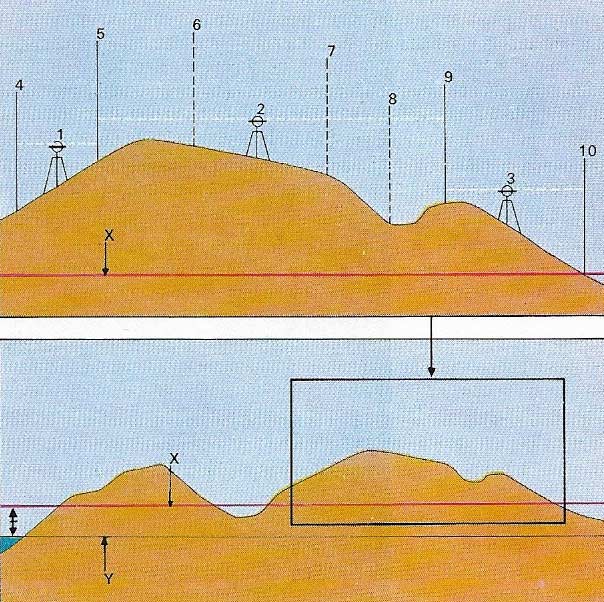
Figure 2. Height above sea-level is usually determined by means of a levelling instrument (1, 2, 3) and a measuring rod (4–10) with reference to a known height or bench mark (X). Level 1 sights on the rod at 4 and then 5. The instrument is moved to 2 to begin the second stage, sighting first on 5 and then on 6. Finally 10 will be reached using stage 3. Intermediate heights are determined by placing the rod at 8. The heights of the points 4–10 can be related to sea-level (Y) because the height above sea-level of the bench mark (X) is already known.
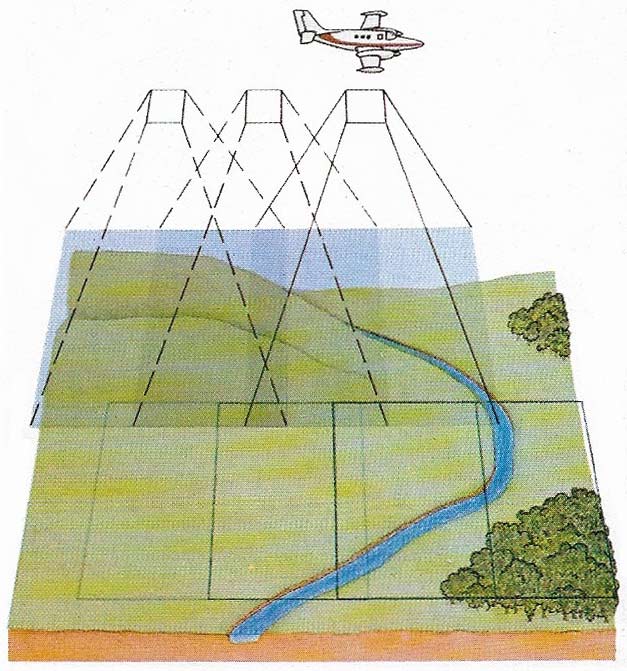
Figure 3. Aerial photography is one of the modern techniques that have helped the work of the cartographer. An aircraft flies over the area to be mapped, taking a continuous series of photographs. The area covered by each photograph overlaps by 60% the area of the previous one and so, after processing, any adjacent pair of photographs can be examined stereoscopically and the relief of the area studied directly in three dimensions. By means of an optical instrument the positions of corresponding points on each photograph can be compared and the height of that point calculated. Each run of photographs over laps sideways by 10% the previous run, ensuring total coverage.
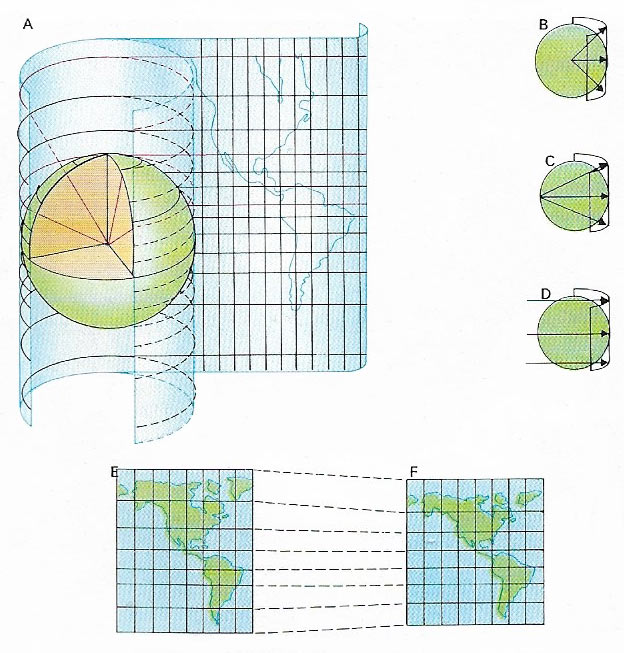
Figure 4. Map projections are mathematical constructions designed to maintain certain selected relationships of the Earth's surface. Some projections are purely geometrical and may be thought of as projections of a transparent globe's parallels and meridians on to a cylinder, cone, or plane. This illustration shows the construction of cylindrical projections (A) and how, by varying the point of projection, different types are produced: simple cylindrical (B), cylindrical stereographic (C), and cylindrical orthographic (D). Mercator's (E) and Miller's projection (F) are both constructed mathematically.
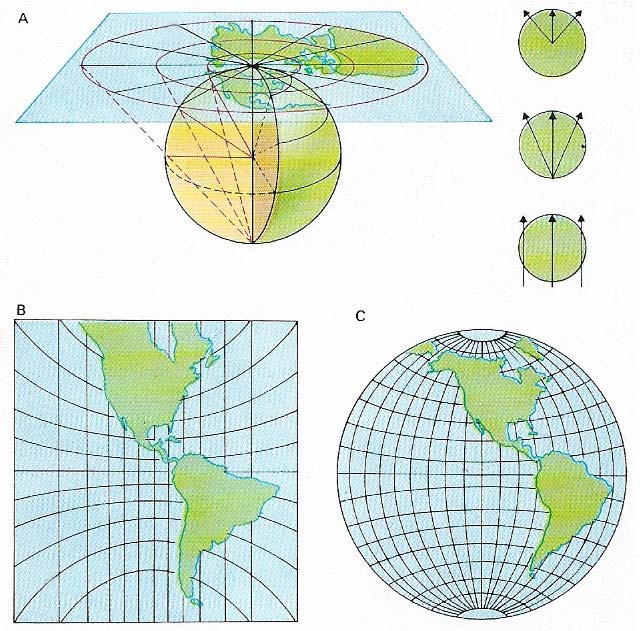
Figure 5. Azimuthal or zenithal projections are those produced on plane surfaces (A). Angles measured from the center (the point of contact with the globe) are correct. However, distortion of shape and area increases with distance from the center. The gnomonic projection (B) shows all great circles (circumferences of planes through the center of Earth) as straight lines. As these are the shortest distances between two points the projection is of importance in navigation. Lambert's azimuthal equal area projection (C) combines usefully the properties of azimuthal projections and equivalence.
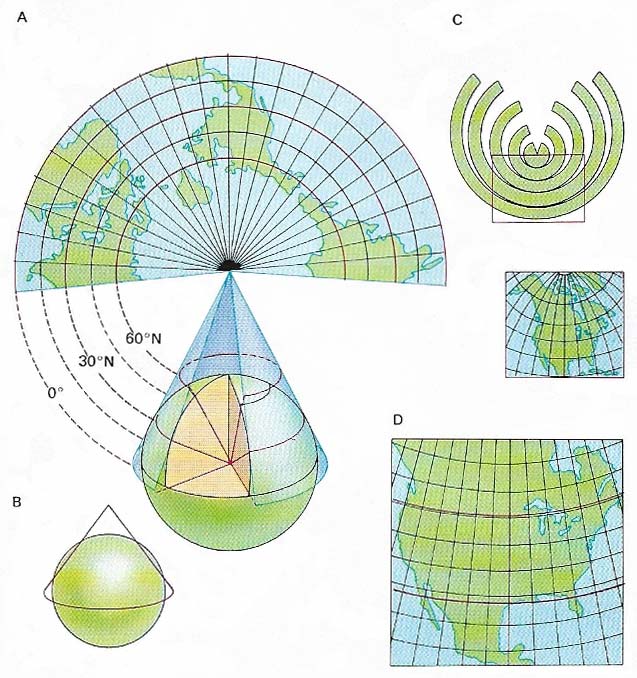
Figure 6. The simple conic projection is constructed from a cone tangential to the globe (A). Scale along the parallel in contact with the globe only – the standard parallel – is correct. Projections constructed from a secant cone (B) have two standard parallels and because scale error increases away from them more of the projection is nearer the correct scale. The polyconic projection (C), mathematically constructed to have all parallels standard, is very accurate over small areas and is therefore used for topographic series. Alber's equal area projection (D) is a modification of the conic projection with two standard parallels (red lines).
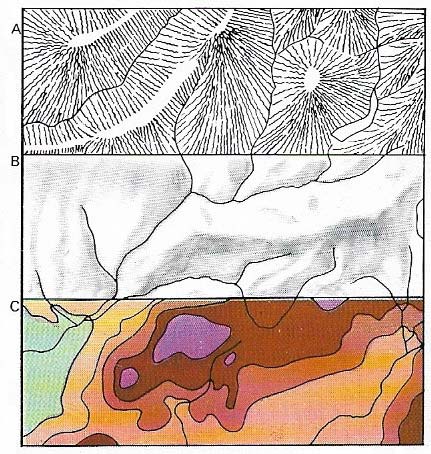
Figure 7. Height and slope can be represented on a map in many ways, including hachuring (A) in which fine lines follow the direction of greatest slope. This method gives an excellent impression of the landscape but may obscure other information. Hill shading (B), the representation of a landscape illuminated from one direction, is used alone or with colors. Contours (C) can be separated by color and intermediate heights given as spot heights.
Throughout history, man has recorded, analyzed, and communicated information in map form. The oldest map in existence is engraved on a Babylonian clay tablet dating from 300 BC and like many surviving examples of early mapping it records land tenure. It was not until the 5th century BC, however, that Greek philosophy stimulated attempts to create a map of the world. Unfortunately these were based on philosophical theories rather than the geographical knowledge of the day. Nevertheless, in the following 600 years Greek scholars did develop a more scientific approach to cartography.
Early attempts at cartography
At the end of the 1st century AD Ptolemy of Alexandria compiled his Geographia. In it he discussed the problem of representing the spherical shape of the Earth on a plane surface and also introduced the concepts of longitude and latitude.
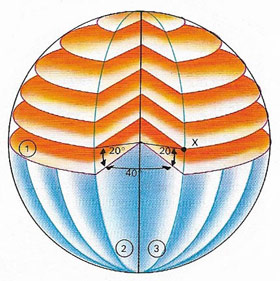 |
| Any point on the Earth's surface can be located in terms of longitude and latitude – in degrees, minutes, and seconds east or west of a prime meridian or line of longitude, and north or south of the equator. The latitude of X (the angle between X, the center of the Earth, and the plane of the equator (1)) equals 20° while its longitude (the angle between the plane of the prime meridian (2) and that passing through X and the poles (3)) equals 40°. |
After Ptolemy, cartography entered a period of decline until the Crusades and an expansion of trade revived interest. A cartographic renaissance came in the fifteenth century with the discovery and publication of Ptolemy's work, voyages of exploration like those of Vasco da Gama (c. 1469–1525) and Christopher Columbus (1451–1506) and the invention of printing and engraving. In the sixteenth century the work of map publishing houses in Holland and France, and particularly that of Gerhardus Mercator (1512–1594), founded modern map-making.
By the middle of the 18th-century the French had initiated the first topographic survey. Many special-purpose of thematic maps have been produced since the nineteenth century. Their variety reflects the increasingly specialized demands of modern life, which require such aids as land-use maps, pilot charts, and road maps.
Modern surveying
Small areas of the Earth can be mapped by plane surveying but large areas must be done by geodesy which takes into account the Earth's curvature. A variety of instruments and techniques is used to determine position, height, and extent of features – data essential to the cartographic process. Instruments such as graduated metal rods, chains, tapes, and portable radar or radio transmitters are used for measuring distances; the theodolite is used for measuring angles. Using measured distances and angles further distances and angles are calculated by triangulation (Figure 1). Heights are determined similarly (Fig 2).
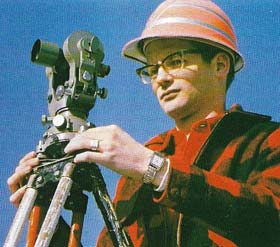 |
| A theodolite is essentially a tripod-based telescope on a base plate that is marked in degrees, minutes, and seconds to allow the surveyor to measure horizontal angles. Vertical readings are made from an upright plate at the side. |
Perhaps the most dramatic changes in cartography have come with the development of aerial survey techniques. Photographs from satellites or aircraft are used together with data from ground surveys to map accurately large areas of Earth. This technique, called photogrammetry, is particularly useful for mapping remote areas (Figure 3), and also for mapping Earth's natural resources using images produced by remote sensing equipment. Almost all topographic mapping today is done from aerial and satellite photography and photomaps are made from the aerial photographs of an area.
Map projection
It is obviously impossible to represent accurately the surface of a sphere on a flat plane without distorting the relationships between features on that surface. A map projection is a device used to plot Earth's features with a minimum of such distortion. There are a number of different types of projection and the choice of one in preference to others depends on the purpose of the map.
If the map is to show relatively small areas of the world, as in a national topographic series that will be used by planners, engineers, and the general public, then a projection must be selected that shows distance, angle, and shape with the utmost accuracy. For this reason conformal projections are chosen. If, on the other hand, the map is to show distribution of, say, cultivated land throughout the world, then a projection that shows those areas at their correct relative size must be selected. Such projections are called equivalent or equal area projections.
Conformal projections are not used for world maps except in special circumstances because they exaggerate polar regions to an enormous extent. The Mercator projection, the best known example, is, however, invaluable to navigators as it shows all lines of constant direction as straight lines.
The first essential in making any map is to establish its purpose. The necessary data must then be assembled – this may be in the form of survey data, aerial photography, existing maps, and written material – analyzed, evaluated, and edited before any drafting can begin. Many factors influence the presentation of information in map form, from the size of paper that can be handled in a cockpit or motor car to the preconceptions of the probable user. The cartographer has at his disposal all the techniques of graphic communication and the written word and they must carefully consider the possibilities they offer when designing the map. Various forms, symbols, lines, and shading may be used. Contours are widely used to represent relief on maps (8) and provide accurate data; however, they give little visual impression of the appearance of the landscape. Cartographers often use layer-coloring for greater clarity and spot heights are marked where an accurate assessment of height or depth is desired, or when a particular crest or low point falls between the contour lines.