butterfly diagram
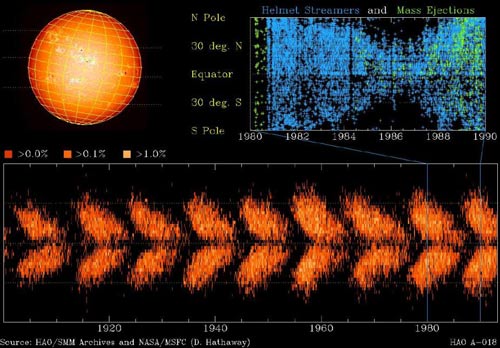
Butterfly diagram for the period 1900–1993.
A butterfly diagram is a plot of heliographic latitude of sunspots versus time, developed by E. Walter Maunder in 1904 to illustrate the solar cycle. It shows how spots move from higher latitudes (30° to 40° N or S) toward the equator throughout each cycle, in accordance with Spörer's law. The shape of the distributions, when plotted for both solar hemispheres, resembles the wings of a butterfly.