geological map
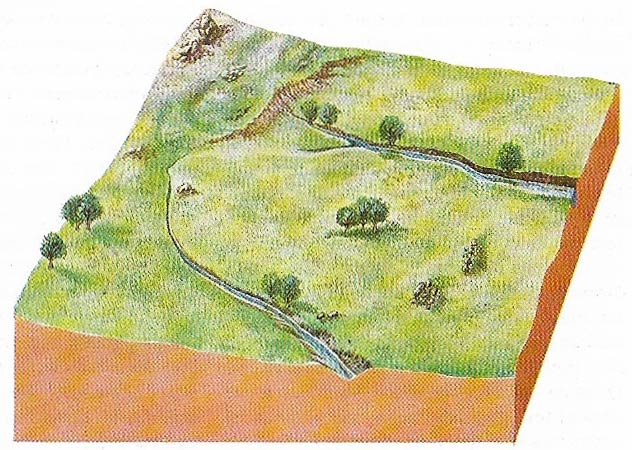
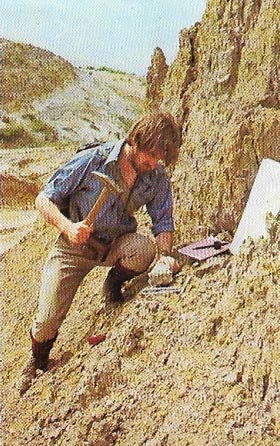
Figure 1. A geologist coming into an area for the first time is rarely faced with a completely exposed sequence of rocks as in the Grand Canyon. More often the rocks in the area of study are concealed beneath soil and vegetation and exposed only occasionally where the natural covering has been removed by the action of water or the weather. The geologist studies each outcrop and from their notes, and the samples they collect for further study, they can reconstruct the area's geological history. The different steps in the study of the area shown here are illustrated in the maps below.
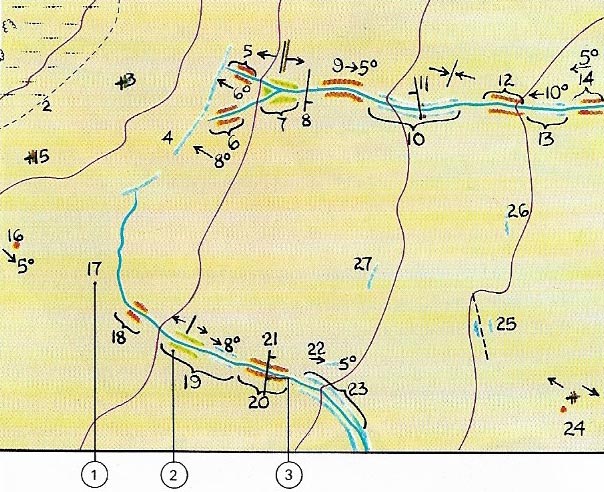
Figure 2. The field data map is usually a relief map of the area which the geologist annotates as they work. Such annotation may take the form of numbers (1) referring to an entry in a notebook, color keying (2) giving a quick visual reference to the rock type, and conventional symbols (3) that describe the folds and faults in the rock.
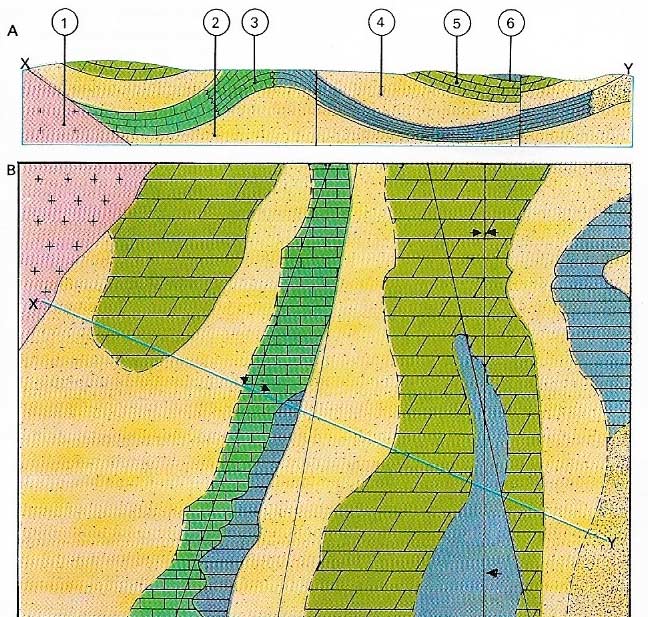
Figure 3. Geological maps are interpreted from field maps. They show the surface disposition of the rocks as if the topsoil and vegetation had been removed (B). The same area is also shown in cross-section (A). A granitic intrusion (1) adjoins a basal sandstone (2). Fossils in a bed (3) identify a Carboniferous formation that grades laterally from limestone to shale and then sandstone. Much of this bed is buried by desert sandstone (4) whereas dolomite (5) and the later shale (6) complete the sequences. The two faults are shown on the map by plain lines. A line with converging arrows is a syncline axis and with diverging arrows an anticline.
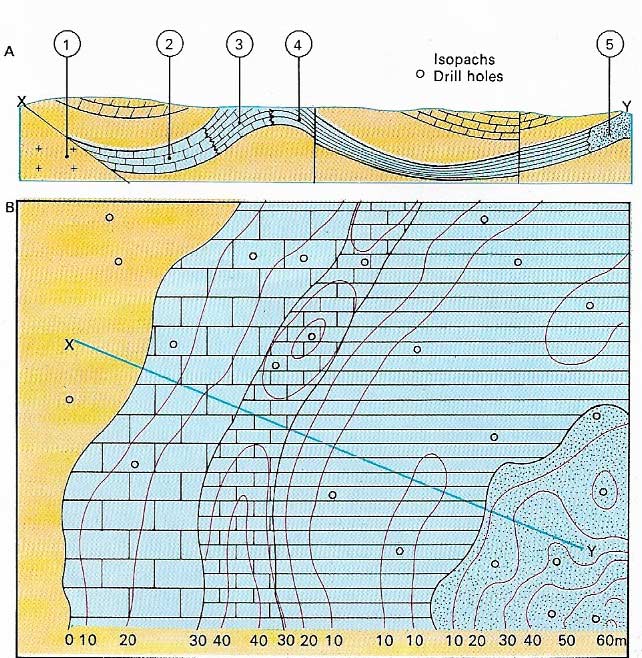
Figure 4. Facies maps reveal the variations of the rocks within a single formation, which is mapped as if all the overlying rocks were removed. The example shown is taken from bed 3 of map 2. The cross-section (A) shows the present disposition of this formation or bed, the facies map of which (B) shows that it consists of a deep-sea limestone (2) cut by a granite intrusion (1) and grading into reef limestone (3). Beyond this, the formation shows shallow-water shales (4) and deltaic sandstones(5). This facies map also shows the thickness of the formation by means of contour lines of equal thickness known as isopachs. These are determined by drilling or by seismological methods.
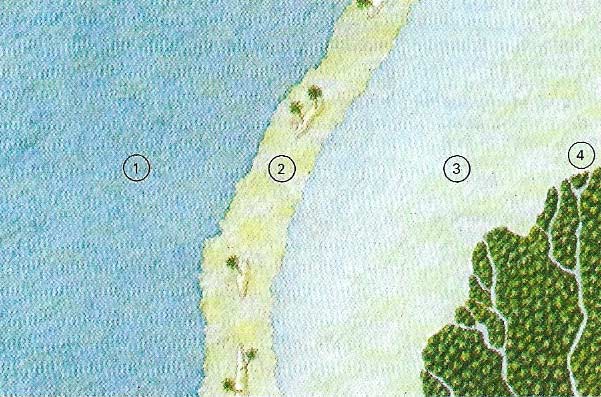
Figure 5. A paleogeographic map is the representation of geographic features at a given geological time. The previous facies map of the formation (3) of map 2, which was deposited during the Carboniferous period, can be translated into this map. The shales and sandstone to the SE show the former existence of a land in that direction and of a river flowing from it and building a delta (4) into a shallow sea (3). Farther out to sea, in waters less than 45 meters (150 feet) deep and more than 20°C (68°F) in temperature, corals and algae built barrier reefs and low-lying islands (2). In the zone of open water (1) beyond the reef, calcareous plant and animal remains accumulated in deposits of limy mud which, in time, became limestone.
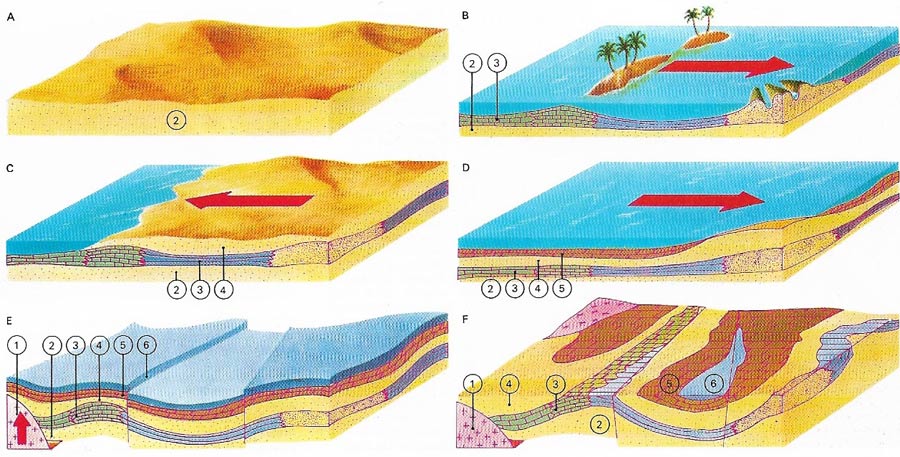
Figure 6. The geological history of the area can be unravelled by the study of all the formations shown in map2A, which are referred to here by the same numbers. The lowest formation (2) is a sandstone deposited in a desert (A). The sea then advanced (B) producing marine conditions (3). When the sea withdrew, a new desert (C) and sandstone formation (4) occurred. A return of the sea (D) brought calcareous sediments (5) and muds (6). Later faulting and folding occurred (E) and granite (1) was intruded into the sedimentary layers. Since then erosion produced today's landscape (F). We can now look at the top illustration with greater understanding.
The structure of rock formations is not always immediately apparent, especially where they are hidden beneath overlying layers of soil or are obscured by vegetation. One of the best ways of determining the relationships between rocks and the processes at work within the Earth is by mapping. Geological maps therefore provide the key to understanding the geological history of any particular region.
 |
| The geologist who sets out to do fieldwork must carry all the tools and measuring devices needed to make observations. Typically, these include a compass and clinometer to take the dips and bearings of bedding planes, faults, and other features. A hand lens is used to examine details in rocks and a camera is useful to record the attitude and structure of rock outcrops. A hammer is essential for breaking open rocks to examine their mineral composition and to ship off samples that are collected for the specimen bag. Most important is the pen and notebook i which all observations, rough drawings, and maps are recorded. |
The basis of geological maps
A geological map (Fig 3) shows the boundaries, or contacts, between various rock units, as if the topsoil and vegetation had been stripped off. Maps also reveal the size and extent of any rock formation.
Formations are the basic units of geological maps. They can be recognized by their well-defined contrast to surrounding layers and by the fact that they can be readily traced in the field. The basic criterion of a formation is that it must be a rock layer of sufficient importance and of sufficiently distinct an identity for geologists to agree about its characteristics – in other words, it must form a unit which can be mapped.
Where formations have been partly obliterated by erosion, or obscured beneath overlying rock and soil, their shape must be pieced together from isolated and often widely scattered outcrops. A single outcrop is usually insufficient to reveal the complex interrelations of the various formations in a region. A geologist must make detailed examinations of numerous rock exposures before he can draw a map that assembles the scattered findings into a coherent picture. Such a map reveals the disposition of the rocks and is the basis for understanding a region's structure and history.
The geologist will also draw up cross-sections of the map, showing a vertical slice through the rocks. Canyon walls and coastal cliffs are natural cross-sections of this kind. However, because of their rarity, the geologists must construct their own interpretative sections. Cross-sections are derived from interpreting the contours and the attitude of surface outcrops and by making test borings. These sections are essential for determining the commercial importance of ores and in preparing to dig tunnels and mines.
With the knowledge of the fundamental principles that apply to the formation of rocks, a geologist can set off into the field to decipher the structures of a specific region.
Techniques of mapping
There are many techniques for correlating rock formations but the best and most obvious method is to trace a continuous exposure over a distance. In most cases, however, rocks are only sporadically revealed, so the geologist must look for lithological similarities in outcrops. Rocks of the same formation are usually similar in color, mineral composition, and texture although, because most strata change gradually over a distance, other means of identification are also used. Certain characteristics of deposition are especially helpful in identifying separate outcrops as belonging to the same formation. These include ripple marks, formed in sand under very shallow water and later preserved in stone; cross-bedding, which is sand deposited on the underwater slopes of a delta; and graded bedding, beds in which the coarser material lies at the bottom and the finer material rests on the top.
A highly reliable technique of correlation is that of finding a similarity of sequence. The position of a layer between other readily identifiable layers is an ideal means of correlating scattered outcrops. The fossil contents of rocks are other excellent tools of correlation. Fossils can be characteristic of specific environments and of specific periods in history. They not only identify the formation in which they are found but also help to determine its age.
The structure of an area is important in determining the history of the rocks since their formation. Not all beds are horizontal. Many have been tilted, folded, and faulted into a variety of twisted positions. In the field, geologists may notice that the bedding planes of the strata in a particular outcrop slope diagonally into the ground. The acute angle between the plane of this rock and the horizontal surface of the Earth is known as the "dip". The angle of dip is measured with a clinometer and is stated in degrees. The "strike" of a rock is the direction in which the face of its bedding plane lies – this is given as a compass direction. Strike and dip together measure the attitude of a formation. The attitude of a rock provides one of the most reliable indications of the sub-surface structure of a particular region.
Paleogeographic maps
By interpreting geological maps and examining rocks for clues about the environment in which they were originally deposited, it is possible to piece together clues to the Earth's past. This information can be represented in paleogeographic maps, which portray the surface features of the Earth as it existed during any given era in history (Figure 5).
Maps can also be constructed so as to show the past distribution of climatic zones. The fossils of organisms that flourished only in specific environmental conditions are an important means of identifying paleoclimates, but more direct indicators of climate can also be found. These include such features as ice-grooves in erosion surfaces and rain pits in sandstone, each telling their own story of the geological history of the Earth.