histogram
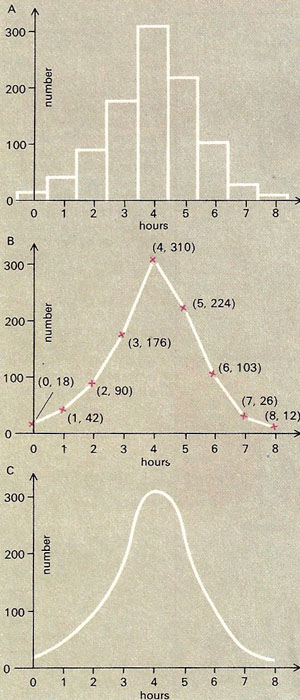
A large number of people were asked how many hours a week they spent watching television. The results of the survey can be represented on a histogram (A), as a frequency polygon (B – with data coordinates indicated), or as a frequency curve (C).
A histogram is a graphical way of representing statistical information (see statistics). The data are classified, and the classes marked off along the x-axis; rectangles whose bases are centered on the class midpoints, and whose heights are proportional to the frequencies in the classes, are then constructed.
Similar is the frequency polygon, constructed by plotting the class midpoints against their respective frequencies and joining the plotted points. If it is meaningful to do so (depending on the shape of the polygon, the certainty felt that the sample is representative of the population, the way that the data has been classified, etc.) a frequency curve may be drawn that best fits the plotted points.