magnetogram
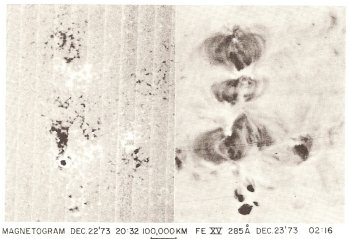
At left, a magnetogram showing solar surface magnetic field structures; and, at right, Skylab photograph in ultraviolet of some area. Credits: Magnetogram from Kitt Peak National Laboratory; photo from Naval Research Laboratory and NASA.
A magnetogram is a chart that shows the strength, polarity, and distribution of magnetic fields across the Sun's disk. It is produced by a magnetograph, which measures Zeeman splitting by taking two narrowband images in a spectral line that is sensitive to the magnetic field. Gray areas in a magnetogram indicate that there is no magnetic field along the line of sight, while black and white areas indicate regions where there is a magnetic field.