phase diagram
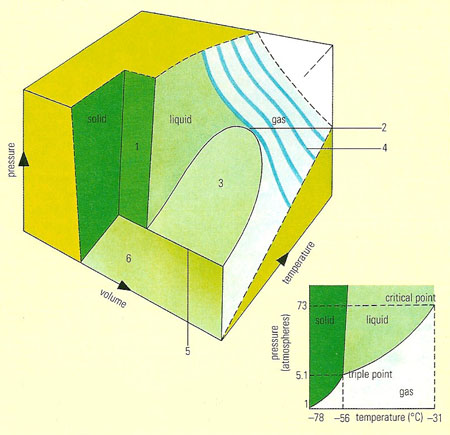
The solid, liquid, and gaseous forms of a particular substance (in the small inset diagram, carbon dioxide is shown) can all exist in mutual contact as a particular temperature and pressure, called the triple point. The three lines show how the boiling, melting, and sublimation change with pressure. Above the critical point the liquid cannot exist at all; only up to that temperature can the gas be liquefied by simply compressing it. In the large diagram, the changes of volume are included: here the solid, liquid, and gas states are symbolized as surfaces, as are the conditions for melting (1), boiling (3), and sublimation (6). The pressure/volume behavior (4) of a gas is simple at high temperatures and more complex near the critical point (2). The triple point is shown as a line (5).
A phase diagram is a graph showing the conditions under which different equilibrium phases of substances exist (see phase equilibria). For example, a curve of melting point against pressure of a pure solid divides the graph into two regions. Points in one represent temperatures and pressures at which the substance is solid; points in the other represent the liquid conditions. Graphs of composition against temperature are used to indicate such features as solubilities and the ranges of stability of alloy phases.