critical point
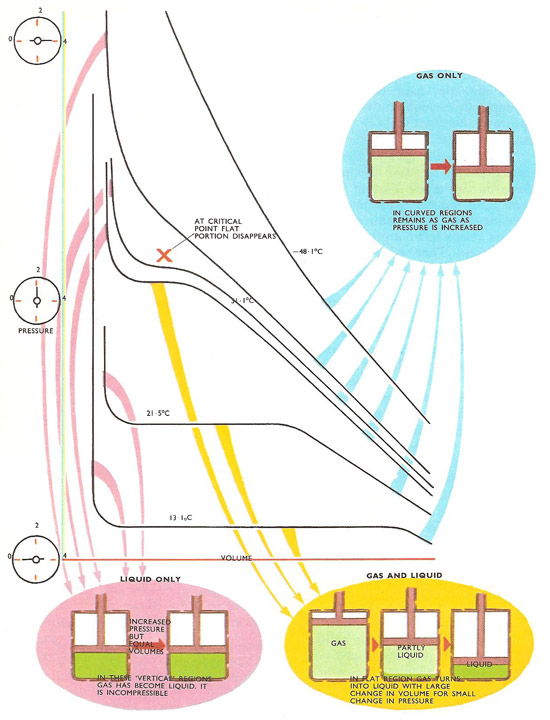
Andrews' family of isothermals for carbon dioxide. At high temperatures the isothermals are smooth curves representing gases being compressed and remaining in gas form. As the temperature is lowered, 'flat' portions appear. The gas is then turning into liquid as the volume shrinks under pressure. Above 31.1°C no flat portion appears – the gas cannot be liquefied no matter what pressure is applied.
If a gas is cooled it eventually reaches its liquefying point and it forms into a liquid. These are the boiling points of the liquids shown when measured at atmospheric pressure. If the pressure is increased the boiling point is increased.
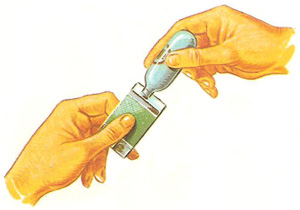
Some substances that are gases under normal conditions of temperature and pressure are kept in the form of a liquid, under pressure. Butane normally is a gas above -0.5°C, but in the capsule it is kept under pressure in the form of a liquid.
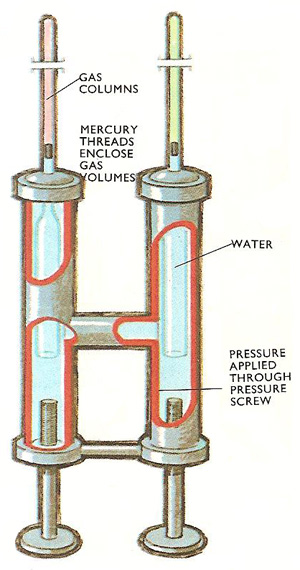
Andrew's apparatus. As the compression screws were applied, the pressure in the water increased and was transmitted equally to the two gas volumes. By measuring the change in length of the air column, the air pressure (which was the same as the carbon dioxide pressure) was found.
In general, the critical point is the point on the phase diagram of a two-phase system at which the two coexisting phases have identical properties and therefore represent a single phase. At the liquid-gas critical point of a pure substance, the distinction between liquid and gas vanishes, and the vapor pressure curve ends. The coordinates of this point are called the critical temperature and critical pressure. Above the critical point a liquid and its vapor phase can no longer coexist. If a gas is slowly compressed at temperatures above the critical temperature or cooled at pressures above the critical pressure, it changes gradually from gas to liquid rather than suddenly separating into two phases.
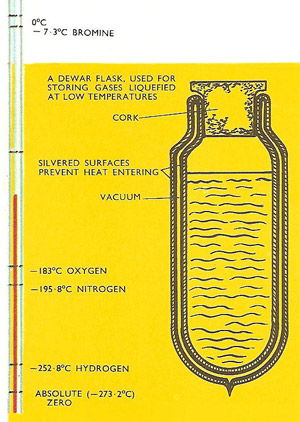
Liquefaction of gases
Vapor, liquid, solid – these are the three phases that a gas passes through as it is cooled. The molecules in a gas are in constant motion, and the higher the temperature, the greater the speeds of the molecules in the gas. As the gas is cooled at a constant pressure the molecules slow down, and the gas occupies a smaller volume. As the average distance between molecules becomes smaller, the forces of attraction between molecules become great enough for them to be bound together in a loose sort of way. The gas has become a liquid.
Another way of thinking of this liquefaction process is to remember that all molecules in a liquid exert a force of attraction to each other. At high temperatures the kinetic energies (the energies of movement) of the molecules are big enough for the forces of attraction to be overcome. When the kinetic energies of the molecules are reduced with the drop in temperature, the molecules can hold together in the liquid.
Apart from cooling a gas, another method of liquefying it is to apply a high pressure.
What happens when a gas is compressed? When gas is cooled, it can change into a liquid because the average distance of separation of molecules becomes small, and the molecular energies are not big enough to enable the molecules to overcome the cohesive forces. Exactly the same two things happen when the gas is compressed. The gas occupies a smaller volume so the average distance between molecules must be smaller. In addition, the energies of the molecules become smaller when the gas is compressed.
If the end of a bicycle pump is stopped and the plunger pressed, the gas inside the cylinder heats up. If the plunger is then fixed, and the gas allowed to cool down to the temperature of its surroundings, the gas has lost heat energy. But the temperature of the gas is the same as it was before the gas was compressed. The energy has lost internal energy because the molecules have been forced closer together as a result of the compression process. Gases can lose internal energy by compression, so it is possible to liquefy the gas using this process.
Andrews' experiments
Thomas Andrews, in 1869, experimented with carbon dioxide gas to try to turn it into liquid carbon dioxide by applying high pressures. He enclosed two gas volumes, one of air and one of carbon dioxide, in two identical tubes. Each volume was enclosed by a short thread of mercury and the tubes were sealed into a metal compression chamber. In the chamber, pressure was applied to a volume of water by screwing in pressure plungers. The high pressures developed in the water volume were transmitted to the two gas volumes. The pressures developed in the water and in the gas volumes were identical. By studying the movement of mercury threads in the air and the carbon dioxide tubes as pressure was increased the changes in gas volume were found. From these changes in pressure in both volumes was calculated. By squeezing the water volume, and watching the positions of the two mercury threads, both the volume and the pressure of carbon dioxide could be found.
Andrews conducted a number of experimental 'runs' and plotted values of volume for different values of pressure, each 'run' being at a definite fixed temperature. So for each temperature he obtained a curve of volume, V, against pressure, P. Such curves, found for definite temperatures, are known as isothermals (same temperature).
Andrews found that he was able to liquefy carbon dioxide as he expected but only if the gas temperature was below a definite value. Liquid carbon dioxide was obtained only if the gas was first cooled below a temperature of 31.1°C, no matter how high the pressure applied. This temperature is called the critical temperature of carbon dioxide. It was later found that each gas has its own critical temperature and it was impossible to turn it into a liquid by compression unless it was first cooled below this temperature.
The isothermal curves
By studying the isothermal curves of a gas under compression, quite a lot can be learned about what is happening as the pressure is increased. Above the critical point the behavior is more or less that of a normal gas.
The volume of gas is inversely proportional to its pressure, a relationship known as Boyle's law. In other words, if the pressure is halved the volume is doubled, if the pressure is doubled, the volume is halved. Mathematically, this is expressed by the formula PV = constant, for a particular temperature. The effect of varying the temperature is expressed in the gas law, which can be written PV = constant × T. For each temperature there is an isothermal curve obtained by plotting values of P against V and these have a definite shape – that of a hyperbola. When a 'P-V' curve of this shape is obtained the gas is behaving in a straightforward manner.
Andrews found that as family of isothermals for different temperatures were plotted those at temperatures approaching the critical point were not smooth hyperbolas, but developed kinks and flat portions. Obviously the gas was no longer obeying Boyle's law. Below the critical temperature, a major part of the curve was flat and almost horizontal. A small change in pressure resulted in a large change in volume, so in this region the gas was reducing its volume enormously – in other words changing into a liquid. Only small changes in pressure were needed to do this. But as the pressure was increased still further, the curve bent and swept upwards into a vertical line. Here the volume hardly changed at all for a large change in pressure. The carbon dioxide had become virtually incompressible, so it must have been totally liquid.
If a gas is cooled it eventually reaches its liquefying point and it forms into a liquid. These are the boiling points of liquids shown when measured at atmospheric pressure. If the pressure is increased the boiling point is increased.