map
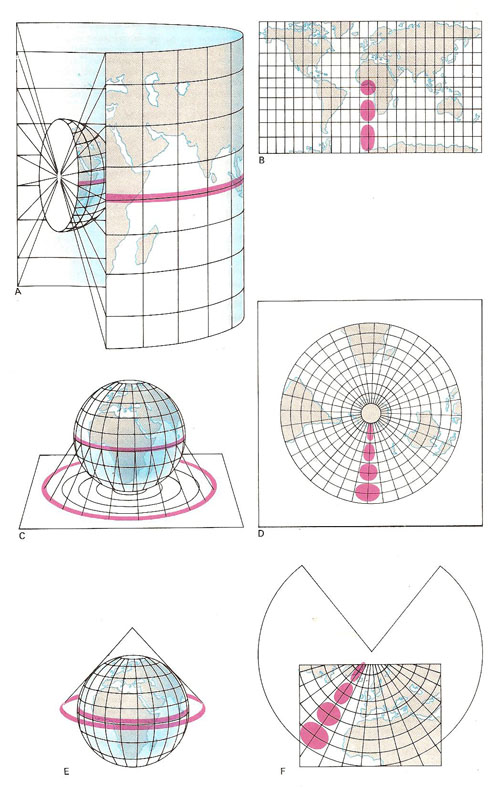
Map projections are attempts to represent the three-dimensional surface of the Earth in two dimensions. (A) Mercator's projection – an equatorial cylindrical projection – yields a map (B) on which areas become increasingly distorted toward the poles (each of which is drawn out into a line at an infinite distance from the equator. (C) An azimuthal projection from the north pole provides a useful map (D) of the southern hemisphere. (E) A conic projection, with elements touching the globe at one (as here) or more parallels, is well suited to mapping mid-latitude regions (F). Red circles represent equal areas, showing the type of distortion produced.
A map is a diagram representing the layout of features on Earth's surface or part of it. Maps have many uses, including route-finding; marine or aerial navigation (such maps are called charts); administrative, political, and legal definition, and scientific study. Cartography, or mapmaking, is thus an important and an exact art. The techniques of surveying and geodesy are used to obtain the positional data to be represented. Since Earth is roughly spherical – the geoid being taken as the reference level – and since the surface of a sphere cannot be flattened without distortion, no plane map can perfectly represent its original, the distortion becoming worse the larger the area. But spherical maps or globes are impractical for large-scale work. Thus plane maps use various projections, geometrical algorithms for transforming the spherical coordinates into plane ones. The choice of projection depends on the purpose of the map; one may aim for correct size or correct shape, but not both at once; a suitable compromise is generally reached.
Projections fall into three main classes: Cylindrical projections are obtained by projection from Earth's axis onto a cylinder touching the equator. Mercator's projection from the center of Earth is a well-known example: its graticule (net of parallels and meridians) takes the form of a rectangular grid with the scale increasing toward the poles, which are infinitely distant; straight lines represent rhumb lines. Conic projections, best suited to middle latitudes, are obtained by projection onto a cone that caps Earth, touching a given parallel. Azimuthal projections are from a single point onto a plane. The gnomonic projection, having the point at the center of the Earth, represents great circle routes by straight lines. The orthographic projection has the point at infinity, the projective rays being parallel; distortion is great, but the map looks like the globe. These geometric projections are now seldom used as such, but are modified to give correct relative areas, distances, or shapes. The scale of a map (assuming it to be constant) is the ratio of a distance on the map to the distance that it represents on Earth's surface. It may be expressed directly as the ratio or representative fraction (1:63360), as a unit ratio (1 inch to 1 mile), or by a graphic graduated scale. Maps use standard symbols and colors to show figures, giving the maximum information clearly. Types of maps include physical, political, economic, demographic, historical, geological, and meteorological maps; there are also star maps.
Maps have been drawn from earliest times, but until the Middle Ages most were little more than sketch maps based on impressions and guesswork except for those of the Greek geographers, notably Ptolemy of Alexandria. In the fourteenth century, Mediterranean sea charts were in use which were remarkably accurate, owing to the introduction of the compass and good estimates of distances sailed. The great voyages of discovery, the rediscovery of Ptolemy's map, and accurate surveying in the Low Countries revolutionized cartography in the sixteenth and seventeenth centuries, the work of Gerardus Mercator and Abraham Ortelius (who produced the first modern atlas) being well-known. Louis XIV promoted a national survey of France, the British Ordnance (1791) followed suit, and in the 19th century most civilized countries produced extensive maps. The US Geological Survey began in 1879. The International Map of the World (IMW), comprising about 1,000 sheets at a scale of 1:1000000, was started in 1913 but is yet to be completed.