Hertzsprung-Russell diagram
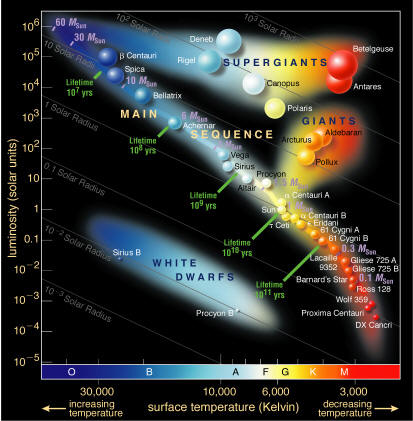
The Hertzsprung-Russell diagram is a graph of stellar color, temperature, or spectral type against stellar luminosity or absolute magnitude. It was first plotted by Henry Norris Russell in 1913, but was discussed independently by Ejnar Hertzsprung at about the same time.
The Hertzsprung-Russell diagram is dominated by the main sequence (so named by Arthur Eddington), which forms a curved, diagonal band from bright blue stars to faint red ones, and contains stars in their core hydrogen-burning stage, and the giant branch, occupied by red giants. Other conspicuous regions are represented by the supergiants (above the giant branch) and the white dwarfs (below the main sequence).
The HR diagram can be seen as both a snapshot of the state of a large collection of stars, or a generalization of the evolutionary pathways of individual stars.
Origin of the Hertzsprung-Russell diagram
The Hertzsprung-Russell diagram had its origin in an anomaly noticed by Ejnar Hertzsprung of the Potsdam Observatory, of which he published details in 1905. From his studies of red stars Hertzsprung noticed that if near stars were arranged in order from type B (white) to type M (red) their absolute magnitude decreased progressively towards the red, but that distant red stars were much more luminous than near red ones – comparable in luminosity to the white stars. Hertzsprung therefore suggested that there were two distinct types of star – one group, which he termed "dwarf" stars, whose luminosity varied with spectral type, and another group, which he called "giants", whose members were all bright stars and showed no variation of luminosity with spectral type. Hertzsprung was later able to distinguish the two types by means of slight differences in their spectra. Dwarf stars were found to greatly outnumbers giant stars.
The director of Princeton Observatory, Henry Russell, independently discovered the same differentiation during a study of the absolute magnitude of the stars he was observing in a parallax program. Russell, with Harlow Shapley, carried out an ambitious program of stellar density determinations, which also confirmed the existence of the two types of stars. In 1911 Russell demonstrated that the stars in many open clusters showed the same properties, almost all of the stars proving to be dwarf type; some giants were however found in two of the clusters. The original H-R diagram was published by Russell in 1913.
Giant branch
The giant branch is a conspicuous sequence of red stars with large radii in the Hertzsprung-Russell diagram of a typical globular cluster, which extends upward from the main-sequence turnoff point to the red giant tip.
Hayashi track
Henyey track
The Henyey track is an almost horizontal track of stellar evolution on the Hertzsprung-Russell diagram, which traces the path of a star, of mass greater than about 0.4 solar masses, that is in in radiative equilibrium, as it moves from its Hayashi track to the main sequence. As a star progresses along the Henyey track – named for the American astrophysicist Louis Henyey (1910–1970) – it contracts and becomes hotter, until its core has become sufficiently small and pressurized for hydrogen burning to begin.
Hertzsprung gap
The Hertzsprung gap is a region of the Hertzsprung-Russell diagram, between the high end of the main sequence (occupied by stars more massive than the Sun) and the giant branch, occupied by very few stars because it corresponds to a relatively very short period in stellar evolution. Among the few types of object that populate this gap are RR Lyrae stars.
Horizontal branch
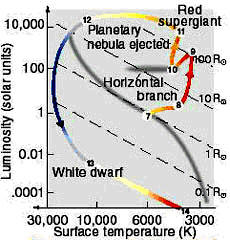 |
| Location of the horizontal branch on the H-R diagram.
|
The horizontal branch is the part of the Hertzsprung-Russell diagram of occupied by the stars in a typical globular cluster. It contains stars with masses of 0.6 to 0.8 solar masses that are hotter and fainter than those on the giant branch. A star appears on the horizontal branch after it has undergone its helium flash and begun to burn helium steadily in its core and hydrogen in a surrounding envelope.
Blue horizontal-branch star
A blue horizontal-branch star (BHB) is a kind of Population II star, found in the galactic halo and especially in globular clusters, that has evolved past the red giant stage and is now burning helium in its core. Blue horizontal-branch stars are typically of spectral type B3 to A0 (hence very blue in color), and have spectra characterized by strong, sharp hydrogen lines, a large Balmer jump (see Balmer series), and very weak lines of other elements.
BHB stars are found on the horizontal branch to the left, blue side of RR Lyrae variables. They are very good tracers because of their extreme brightness and the fact that most faint blue stars seen in the halo are usually BHB stars.
Red giant tip
The red giant tip is the upper tip of the red giant branch in the Hertzsprung-Russell diagram; it represents the helium or carbon flash point where density and temperature of the core have become so high that the "ash" in the core is ignited and serves as the fuel for a new series of nuclear reactions.
Turnoff point
The turnoff point is the point on the Hertzsprung-Russell diagram at which stars in a cluster depart from the main sequence. The brighter the turnoff point, the younger the cluster age. The turnoff mass is the least mass of a star (in a group) that has had time to begin evolving away from the main sequence.