line spectrum

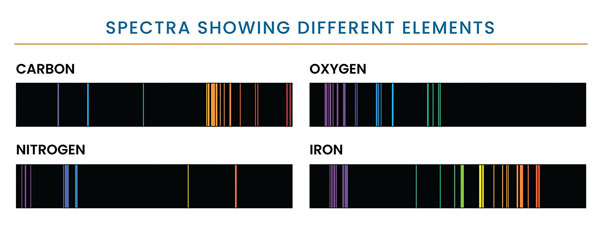
Figure 1. Each element in the periodic table can appear in gaseous form and will produce a series of bright lines unique to that element. This graphic shows the unique set of emission lines of 4 elements: carbon, oxygen, nitrogen, and iron. Credit: NASA and STSci.

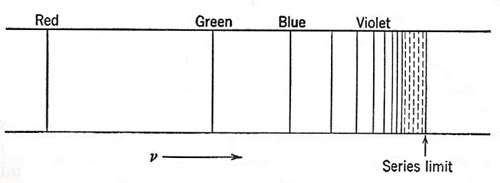
Figure 2. The sequence of lines composing the Balmer series, as they appear on a frequency or wave-number scale.
A line spectrum is a pattern of lines, each corresponding to an image of the entrance slit of the spectrometer, seen when light is either emitted by or interrupted by a hot rarefied gas. The pattern is characteristic of the gas (Figure 1), and the wavelength at which the features are seen to occur is indicative of the velocity of the object.
Historical developments
The subject of spectroscopy is quite an old one, and the knowledge that an incandescent vapor or flame emits a spectrum of distinct lines rather than a continuous range of colors is of long standing. It was recognized that the set of lines in the spectrum of a pure element was characteristic of that element, and that one could make use of this fact in chemical analysis, or even in the discovery of new elements. The first successful quantitative result of studying spectra, in the sense of finding significant relations between the various lines due to one element, was achieved by Hartley (1883). He noticed that, if he used frequencies instead of wavelengths, the frequency differences between members of certain characteristic groupings of spectral lines were the same for all such groupings at different regions of the spectrum of a given element.
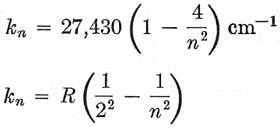
The search for a more far-reaching relationship among the various lines of a spectrum was impeded by the idea, which proved to be quite wrong, that a vibrating optical system would exhibit a set of harmonics, like an acoustic resonator or a vibrating string. But in 1885 Balmer showed that a set of lines in the spectrum of atomic hydrogen (Figure 2) could be represented very accurately by the equation
 |
for n = 3, 4, ..., 11.
Rydberg (1890) suggested that this expression should be rewritten in terms of frequencies, or rather of wave numbers k (= 1/λ), giving
 |
where R = 109,720 cm–1 and is called Rydberg's constant. In this last form the description of the Balmer series is very suggestive, because we at once have the possibility that other spectral sequences exist, defined in general by
 |
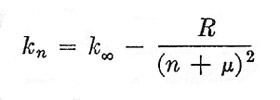
where n0 and n are both integers. This was not, however, realized at the time. The difficulty was not merely the complexity of spectra, out of which one must try to select the lines belonging to a single sequence, but also the fact that only a few series can be represented in this simple way. When the attempt was made to analyze the spectra of the alkali metals, it was found by Rydberg that the wave numbers were given by expressions of the form
 |
where represents the series limit for n = ∞ (it is evident that the lines crowd more and more closely together as n increases), R is the same constant – the Rydberg constant – that appears in the description of the Balmer series n is an integer and μ is an appropriately chosen fraction. Certain connections were also found between different spectral series for the same element, but it is more profitable to defer consideration of these until after we have developed the theory of the atom according to wave mechanics. It should be mentioned, however, that in 1908 Lyman discovered a hydrogen series (in the ultraviolet) described by the formula
 |
with n0 = 1, andin the same year Paschen found a similar series in the infrared with n0 = 3. These, together with the Balmer series (n0 = 2) were powerful evidence of a great simplicity in the problem, wich came with Bohr's theory of the hydrogen atom.


